Design summary
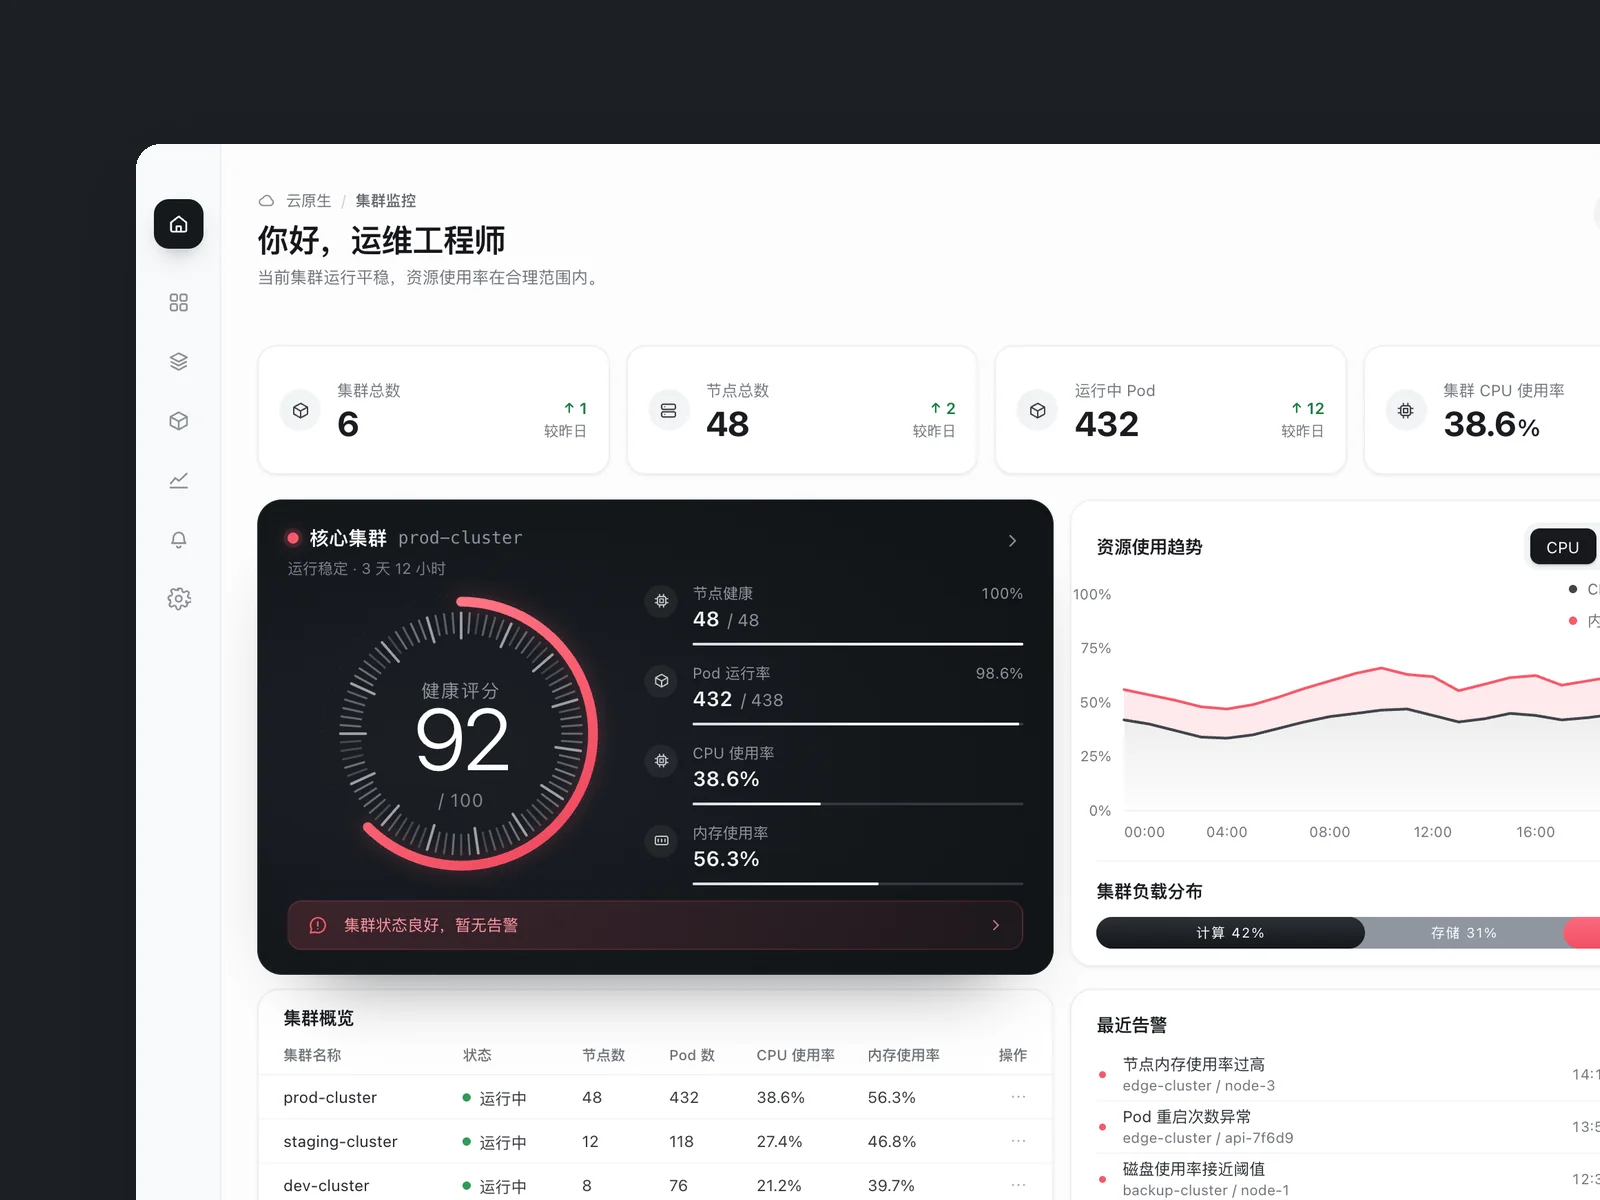
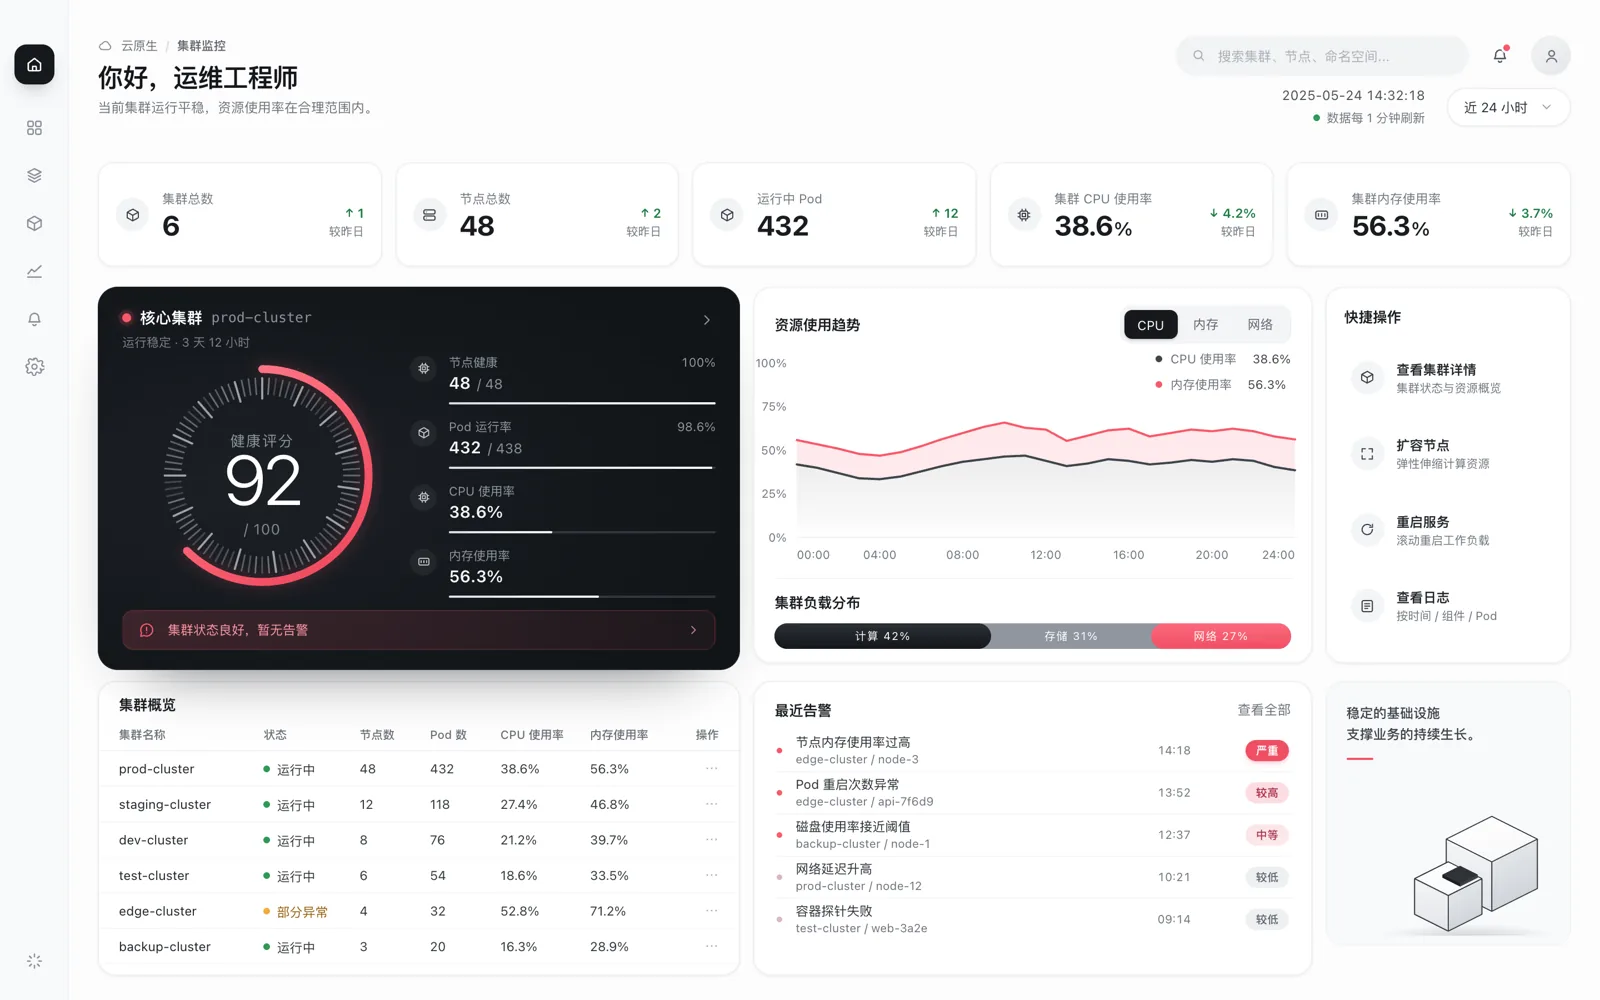
The Cloud Native · Cluster Monitor workspace combines a compact icon rail, cool gray canvas, and an obsidian 'Core Cluster prod-cluster' health dial (92/100 score ring and four resource watermarks) in a single-screen SRE console. It presents five top-level metrics across 6 clusters, 48 nodes, and 432 running Pods, a dual-series Resource Usage Trend chart across CPU/Memory/Network and three time windows, a Compute/Storage/Network load bar, quick scaling and restart actions, a six-cluster table, and recent alerts.
Prompt
Design and build the 'Cloud Native · Cluster Monitor' operations workspace (1440×900): a compact left icon rail paired with a top bar containing global cluster/node/Pod search, a healthy status badge, and a New Cluster action. The top row aligns five core metrics: Total Clusters (6), Total Nodes (48), Running Pods (432), Cluster CPU Usage (38.6%), and Cluster Memory Usage (56.3%). The middle row places an obsidian 'Core Cluster prod-cluster' health dial (92/100 score ring plus CPU, memory, disk, and network watermarks) on the left, a dual-series Resource Usage Trend chart (switching across CPU / Memory / Network and Last 24h / 7d / 30d) with a segmented Cluster Load Distribution bar (Compute 42%, Storage 31%, Network 27%) in the center, and three Quick Actions (Node Scaling, Rolling Restart, View Logs) on the right. The bottom row combines a six-cluster table (prod / staging / dev / test / edge / backup-cluster), a Recent Alerts list, and an isometric cluster status illustration card.
Multi-metric trend switching, live cluster filtering, and closed-loop operations actions are the core of this piece: switching metrics and time windows redraws the dual-series curve, the search input filters cluster rows in real time, and clicking New Cluster, Node Scaling, Rolling Restart, View Logs, or All Alerts opens the corresponding action modal.
View Chinese original
设计并实现「云原生 · 集群监控」运维工作台(1440×900):左侧采用紧凑图标导航栏,顶部提供集群/节点/Pod 全局搜索、运行正常状态徽章与新建集群入口。首屏顶部横向排列集群总数(6)、节点总数(48)、运行中 Pod(432)、集群 CPU 使用率(38.6%)与集群内存使用率(56.3%)五项核心指标;中区左侧为曜石黑「核心集群 prod-cluster」健康度表盘(92/100 评分环及 CPU、内存、磁盘、网络四维水位条),中区中央为支持 CPU/内存/网络与近 24 小时/近 7 天/近 30 天切换的资源使用趋势双线图及计算(42%)、存储(31%)、网络(27%)负载分布条,右侧为节点扩缩容、滚动重启与查看日志三项快捷操作;底部并置六套集群列表(prod / staging / dev / test / edge / backup-cluster)、最近告警列表与云原生集群状态插画卡。
多维监控趋势切换、集群检索与运维动作闭环是这件作品的核心:切换监控指标与时间跨度实时更新双序列曲线,搜索框实时过滤集群行,点击新建集群、扩缩容、滚动重启、查看日志或全部告警均可打开对应操作面板。