Nightwatch
Prompt
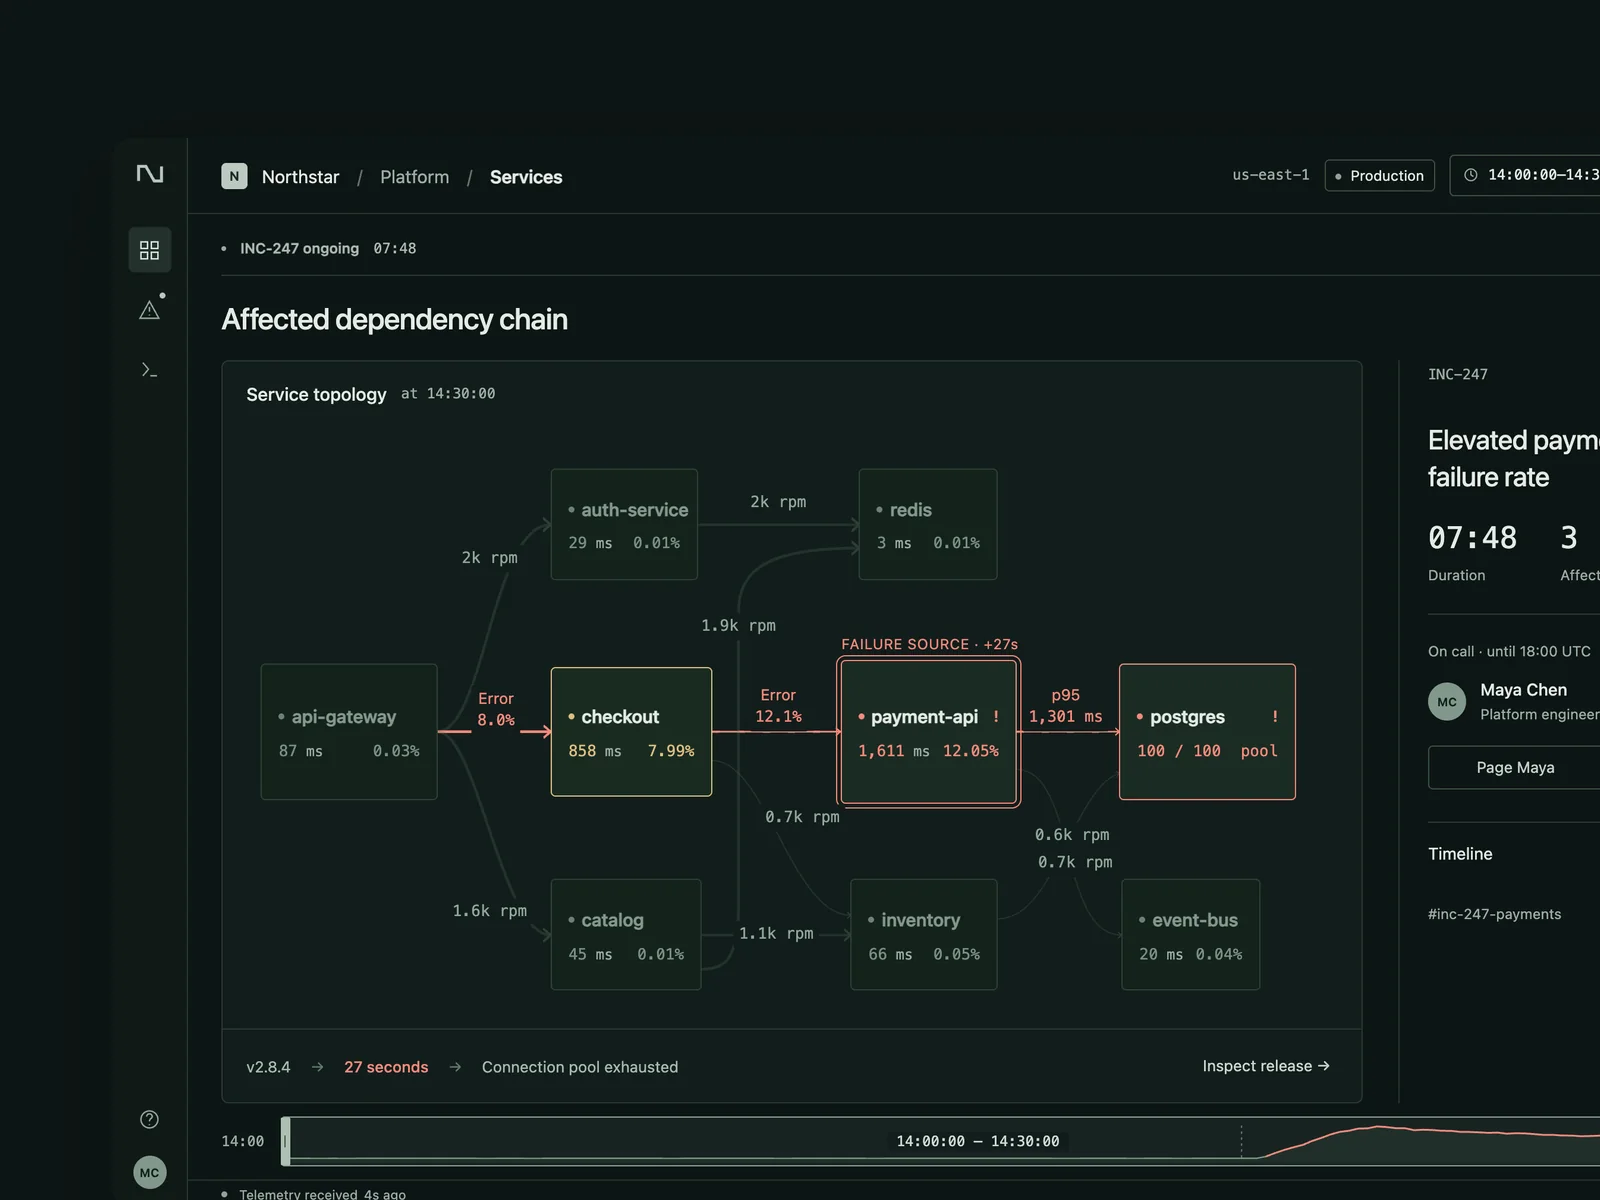
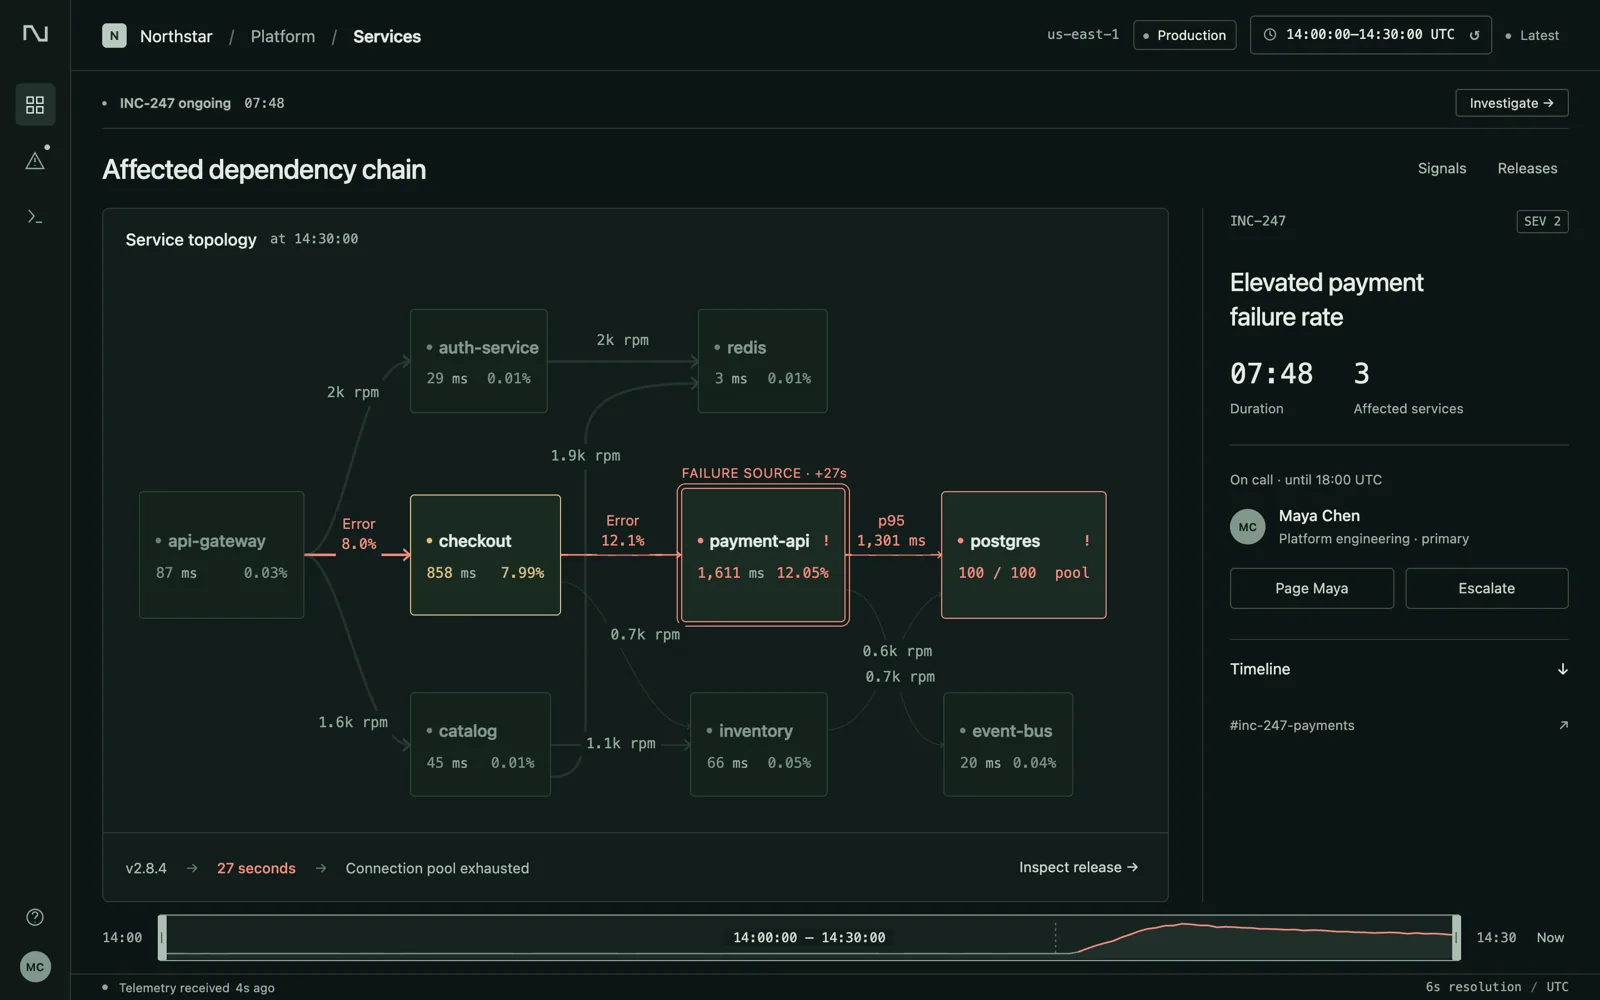
A monitoring and on-call tool for a medium-sized platform team (1440×900), with an English interface: service topology, latency, error-rate and traffic charts, recent deployments, logs, and traces; during an incident, show alerts, the current on-call person, and an incident timeline.
An incident unfolding is the core: the failing service and affected downstream services should be obvious in the topology. Dragging the time range should align charts, deployment markers, and logs so users can see which deployment caused the problem.
Design three states: a healthy overview; an incident in progress with an alert and the affected path highlighted in the topology; and logs and traces opened at the error peak to identify the deployment responsible.
View Chinese original
一个给中等规模平台团队用的监控和值班工具(1440×900),界面用英文:服务拓扑,延迟、错误率、流量曲线,最近的发布,日志和调用链;出故障时有告警、当前值班人和事件时间线。
故障正在发生是这件作品的核心:拓扑上出问题的服务和受牵连的下游一眼能看到;拖动时间范围,曲线、发布标记和日志对齐,能看出是哪一次发布引起的。
设计三个状态:一切正常的总览、故障进行中(告警触发、拓扑标出受影响路径)、在错误峰值上展开日志和调用链并定位到那次发布。